Understanding Your Analytics Dashboard
Learn how to navigate the RapidQuote3D analytics dashboard, interpret key metrics, and use date filters and charts to gain actionable insights into your business performance.
Overview
The Analytics dashboard gives you a comprehensive, real-time view of your 3D printing business performance. From revenue trends to material popularity, every key metric is presented in an easy-to-read format so you can make data-driven decisions with confidence.
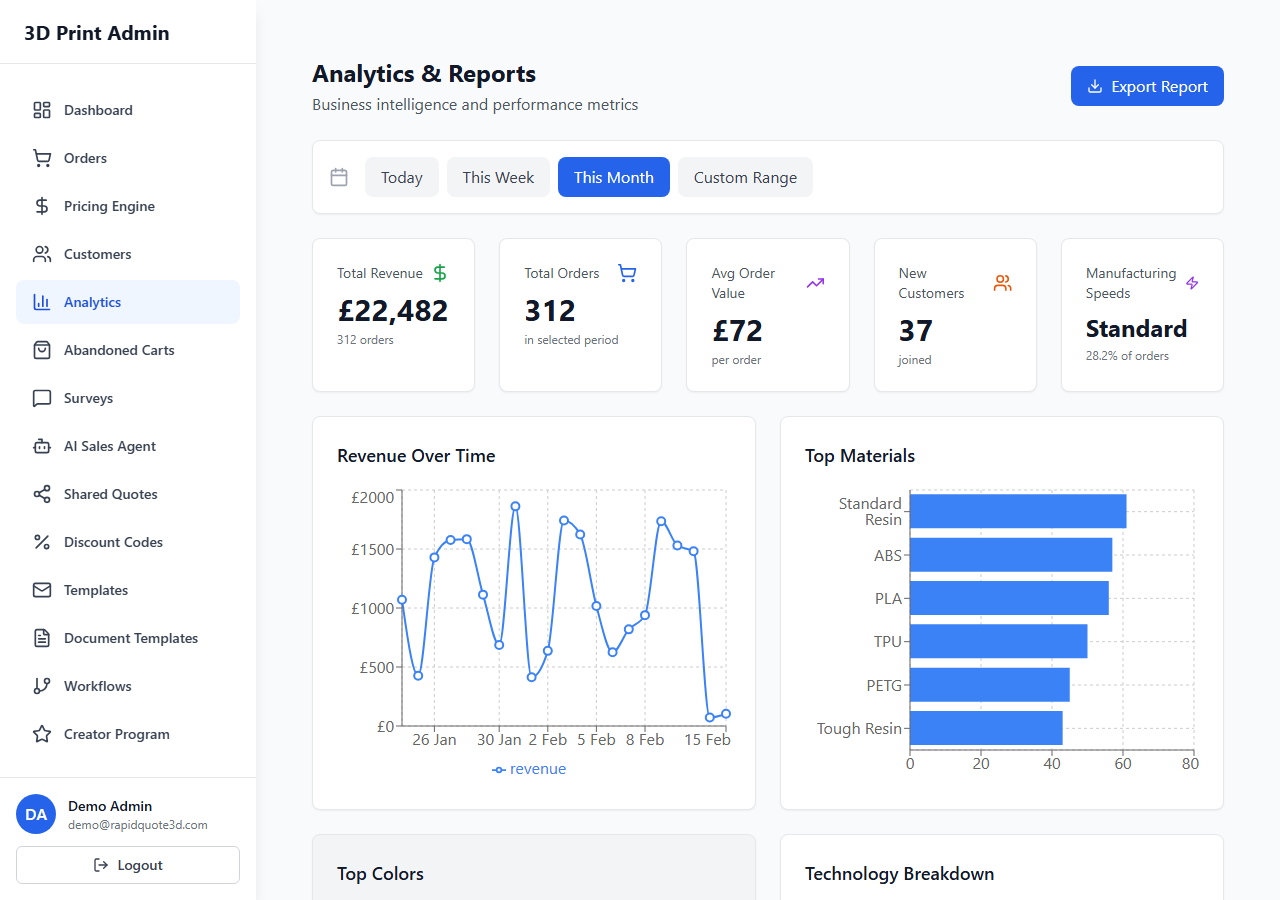
Navigating to Analytics
To access your analytics:
- Log in to your RapidQuote3D admin dashboard.
- Click Analytics in the left-hand sidebar navigation.
- The analytics page loads with your default date range (last 30 days).
Date Range Selector
At the top of the analytics page you will find the date range selector. This controls the time period for all charts and stat cards on the page.
- Last 7 days – a quick snapshot of the past week.
- Last 30 days – the default view, ideal for monthly reviews.
- Last 90 days – a quarterly perspective on trends.
- Custom range – pick specific start and end dates using the calendar picker. Useful for comparing promotional periods or specific campaigns.
After selecting a range, all data on the page updates automatically. The selected range is displayed at the top so you always know what period you are viewing.
Overview Stat Cards
Directly below the date range selector, four summary cards provide at-a-glance metrics:
| Stat Card | What It Shows |
|---|---|
| Total Orders | The number of orders placed during the selected period, with a percentage change compared to the previous equivalent period. |
| Revenue | Total revenue earned from completed orders, displayed in your configured currency. |
| Average Order Value | Revenue divided by the number of orders, helping you understand spending patterns. |
| New Customers | The count of first-time customers who placed an order during the period. |
Each card shows a green or red indicator to highlight whether the metric has increased or decreased compared to the previous period of the same length.
Chart Types
Below the stat cards, several interactive charts visualise your data:
Orders Over Time (Bar Chart)
This bar chart plots the number of orders per day (or per week for longer ranges). Hover over any bar to see the exact count and date. Use this to spot busy days and plan capacity accordingly.
Revenue Over Time (Line Chart)
A line chart showing daily revenue trends. This helps you identify revenue peaks, seasonal patterns, and the impact of marketing campaigns or pricing changes.
Orders by Material (Pie Chart)
This pie chart breaks down orders by material type (e.g., PLA, ABS, PETG, Resin). Hover over each segment to see the percentage and order count. Use this to understand which materials are most popular with your customers.
Orders by Technology (Pie Chart)
Similar to the material breakdown, this pie chart shows orders segmented by printing technology (e.g., FDM, SLA, SLS). This is valuable for capacity planning and investment decisions.
Top Customers Table
A table listing your highest-value customers for the selected period, showing their name, number of orders, and total spend. Click any customer row to navigate to their full profile.
Exporting Data
To export your analytics data:
- Set the desired date range using the selector at the top.
- Click the Export button in the top-right corner of the analytics page.
- Choose your preferred format (CSV is available for spreadsheet analysis).
- The file downloads to your computer, containing all metrics for the selected period.
Exported data is ideal for creating custom reports, sharing with stakeholders, or importing into external business intelligence tools.
Tips for Using Analytics Effectively
- Review analytics weekly to catch trends early and respond to dips in orders or revenue.
- Compare custom date ranges around promotions to measure their true impact.
- Use the material and technology breakdowns to guide inventory purchasing and machine maintenance schedules.
- Monitor average order value over time — a declining AOV may indicate a need to revisit your pricing or upselling strategy.
Need help with this topic? Contact our support team