Tracking Manufacturing Performance
Monitor your manufacturing efficiency by comparing actual versus estimated print times, tracking performance by technology and material, and using data to refine your time estimates.
Overview
Accurate manufacturing data is the backbone of a profitable 3D printing business. RapidQuote3D tracks your actual production performance against your quoted estimates, giving you the insight you need to improve efficiency, set realistic lead times, and maintain healthy margins.
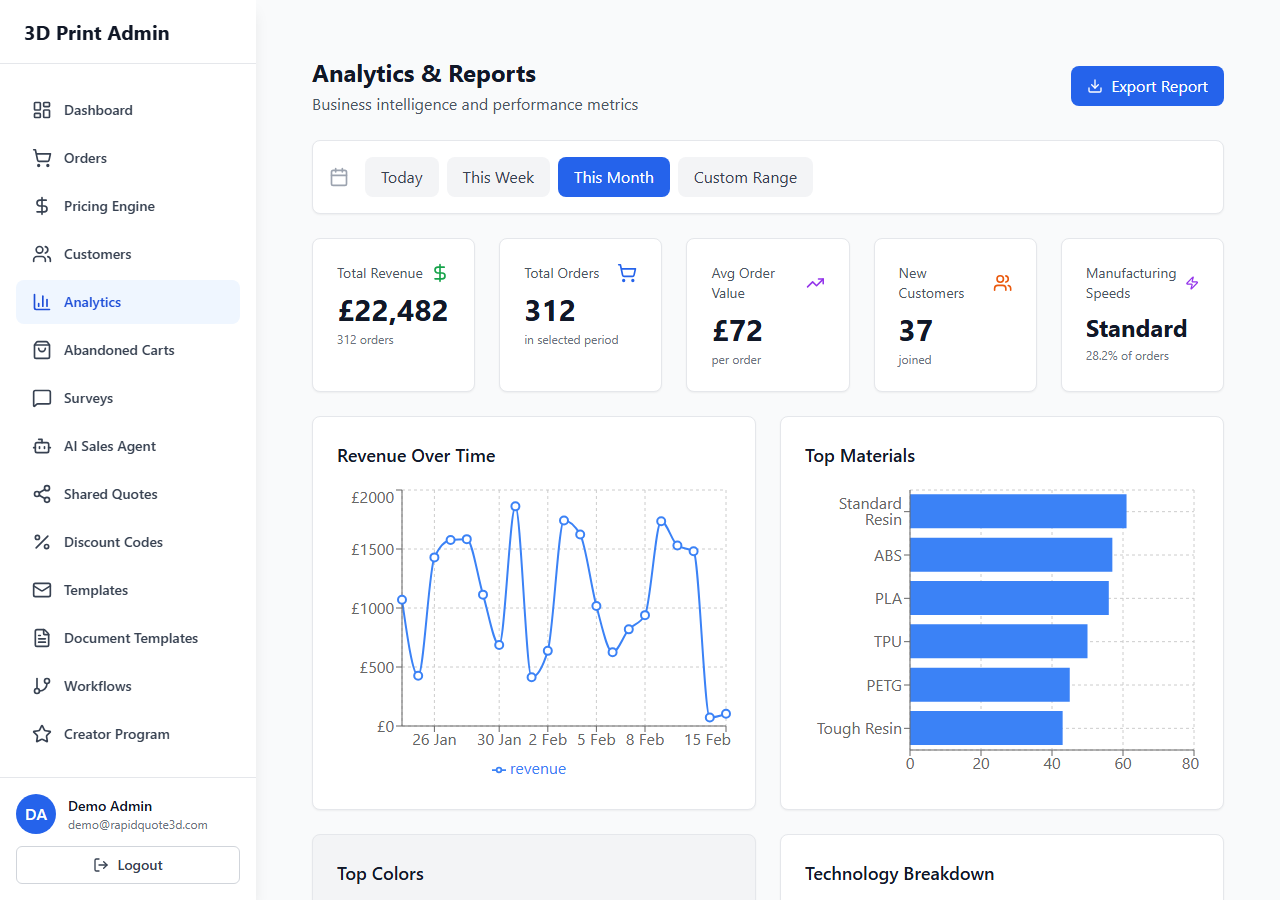
Accessing Manufacturing Metrics
- Navigate to Analytics from the sidebar.
- Scroll down past the overview charts to the Manufacturing Performance section, or click the Manufacturing tab if available.
- Select your desired date range to filter the data.
Actual vs Estimated Print Times
One of the most valuable metrics is the comparison between the print time you estimated when quoting a job and the actual time it took to complete. This section displays:
- Estimated time – the print duration used to calculate the customer’s quote.
- Actual time – the real production time recorded when you mark a job as complete.
- Variance – the difference between the two, shown as both a time value and a percentage.
A positive variance means jobs are taking longer than estimated (eating into your margins), whilst a negative variance means you are completing jobs faster than quoted.
Recording Actual Times
To ensure accurate tracking, update each order with its actual print time when marking it as complete. You can do this from the order detail page by entering the real duration before changing the status to Completed.
Efficiency by Technology
This breakdown shows your average efficiency rate grouped by printing technology:
| Technology | Avg Estimated | Avg Actual | Efficiency Rate |
|---|---|---|---|
| FDM | 4.2 hrs | 4.5 hrs | 93% |
| SLA | 3.0 hrs | 2.8 hrs | 107% |
| SLS | 6.5 hrs | 7.1 hrs | 91% |
Example data shown above for illustration. An efficiency rate above 100% means you are completing jobs faster than estimated, whilst below 100% indicates jobs are running slower.
Efficiency by Material
Similar to the technology breakdown, this view groups efficiency data by material. This is particularly useful because certain materials (e.g., flexible filaments, high-temperature resins) often require slower print speeds or more post-processing time.
Identifying Slow-Running Jobs
The manufacturing performance section highlights outlier jobs where the variance between estimated and actual time exceeded a significant threshold. Look for:
- Jobs with variance above 20% – these may indicate issues with specific geometries, materials, or machine calibration.
- Recurring patterns – if a particular material or technology consistently runs over estimate, your base time calculations likely need adjusting.
- Failed prints – jobs that required reprinting will show much longer actual times. Recording these helps you account for failure rates in future quotes.
Improving Your Time Estimates
Use the data from manufacturing performance to refine your pricing engine estimates:
- Review the efficiency rate for each technology and material combination over a 90-day period.
- If a technology consistently runs at 90% efficiency, consider increasing your estimated times by 10% in your pricing configuration.
- Navigate to Settings > Pricing and adjust the time multipliers or base rates for the affected technologies and materials.
- Monitor the impact over the following weeks to see if the variance narrows.
Understanding Utilisation Rates
Utilisation rate measures how much of your available machine capacity is being used for active production. A higher utilisation rate means your equipment is being used efficiently, but running consistently above 90% may indicate you need additional capacity to handle demand spikes.
- Below 50% – significant spare capacity. Consider marketing efforts to attract more orders.
- 50–80% – healthy utilisation with room for growth.
- Above 80% – nearing capacity. Plan for additional equipment or longer lead times.
Best Practices
- Always record actual print times when completing orders to keep your data accurate.
- Review manufacturing performance monthly and adjust estimates quarterly.
- Use the technology and material breakdowns to identify where training or equipment upgrades would have the biggest impact.
- Factor in post-processing time (support removal, curing, sanding) when recording actual times for a complete picture.
Need help with this topic? Contact our support team